Building a Real-Time Property Scoring Pipeline: The Engine Behind BirdEarly
What We Built and Why It Was Interesting
BirdEarly needed a scoring engine — not a report, not a dashboard, not a summary feature. An engine that runs automatically when a property enters the system, evaluates it across multiple dimensions, and writes structured outputs back to the database before anyone on their team opens the record.
The product they were building is a daily ranked feed of MLS opportunities for real estate investors. Every property pre-analyzed, pre-scored, pre-prioritized. The engine is not a feature inside that product. It is the product.
GTC built it. This post covers the engineering decisions behind it and what it takes to make something like this reliable in production.
The Core Problem: Evaluation at Speed
The data BirdEarly’s investors needed was already available on the MLS. The problem was not access. It was time.
A good deal can move in 24 to 48 hours. Manual evaluation — going through photos, reading descriptions, pulling comps, forming a view on condition and value — takes more time than any investor has for every property hitting the market daily. By the time the analysis is done, the deal is often gone.
The engineering challenge was to compress that evaluation to near-zero time. Every property scored automatically, within minutes of entering the system, at a quality standard an experienced investor would trust.
That required more than calling an API. It required a pipeline with quality controls, conditional processing logic, confidence scoring, and independent failure handling at each stage. The sections below describe how each part was designed and why.
Why Event-Driven, Not Batch
The engine runs on an event-driven architecture — properties are scored as they arrive, not on a fixed schedule.
The alternative, a nightly batch job, sounds simpler but creates a problem. A property listed at noon, with updated images at 3pm, scored at 2am is stale data. In a slow market that might not matter. In a competitive market it often does. The investor sees a score based on information that is already hours old.
Event-driven processing closes that gap. A property enters the scoring queue the moment it enters the system. Each stage of the pipeline runs as soon as the prior stage finishes. A fully scored property is ready within minutes of appearing on the MLS.
From an engineering standpoint, this also means each processing stage runs independently. A failure in one stage does not block work moving through any other. The system is resilient by design, not by accident.
How the Engine Works
The pipeline has five stages. They run in sequence for each property, with image analysis and description analysis running in parallel within the same pass.
Stage 1: Intake and image preparation
When a property enters the system, its core record is written to the database and its MLS image URLs are stored. From there, two tracks begin simultaneously — image analysis and description analysis.
Before image scoring begins, a preprocessing step runs first. It pulls the listing images, uploads them to standardized storage, and evaluates the image set for scoring viability. Not every set of listing photos is worth running through an analysis model. Some are too low resolution, poorly lit, or shot at angles that make condition assessment unreliable.
If the images do not clear a quality threshold, the property is flagged rather than silently scored on bad data. A low-quality score presented with the same confidence as a high-quality one would mislead investors. Flagging is the honest response.
Full image scoring also only runs when at least 30% of the images have changed since the last evaluation. Re-analyzing a property whose photos have not materially changed is unnecessary work at scale. The pipeline saves compute for when it is actually warranted.
Stage 2: Image scoring
Properties that pass the quality gate are evaluated across three dimensions: interior condition, exterior condition, and the surrounding environment.
Interior looks at room condition, finishes, visible systems, and deferred maintenance signals. Exterior covers the building envelope — roof, siding, windows, paint, foundation where visible. Surrounding evaluates the immediate context: yard, neighboring properties, street condition, landscaping.
Each dimension produces a numeric score, a confidence rating, a weightage, and a plain-language description of what the model observed. The weightage is not static. If a property has ten clear exterior images and two interior shots, the exterior score carries more weight in the overall assessment. The model uses what it actually has, and the output reflects that.
The plain-language observation is as important as the number. A score places the property on a range. The observation explains what drove it. Investors making acquisition decisions need both.
Stage 3: Description scoring
In parallel, the listing description is evaluated using GPT-4. This step also runs conditionally — only when the description has changed since the last assessment.
The model scores the description on two dimensions. The first is how favorably it presents the property: language signaling recent upgrades, strong location, or move-in condition scores higher. The second is how strongly it signals renovation need or motivated selling: phrases like “sold as-is,” “investor special,” and “priced to sell” are clear indicators, as is the absence of any update language on an older-vintage property.
Listing language is rarely direct. “Charming and full of character” often means dated and in need of work. “Cozy” frequently means small. A model reading the full description in context reads those signals accurately. Keyword matching does not.
Stage 4: Distress scoring and opportunity ranking
Once both tracks complete, the scoring step aggregates their outputs into two numbers.
The first is a total distress indicator — a composite measure of how much work the property likely needs, combining image-derived condition signals with description-derived renovation signals. A property with poor interior and exterior scores, compounded by heavy “as-is” language in the description, scores high on distress.
The second is the opportunity score — the number investors use to rank their daily feed. This is not a pure distress score. A highly distressed property in a strong market, priced to reflect its condition, may represent a better opportunity than a lightly distressed property in a flat market at a premium. The opportunity score accounts for that context. Distress alone does not determine whether a deal is worth pursuing. Pricing and market position matter equally.
Both scores are stored alongside prior versions. The history of how a property’s scoring has shifted since entering the system adds signal that a single snapshot cannot provide.
Stage 5: Valuation and offer range
The final stage estimates financial value and generates a suggested offer range.
The valuation step produces a fair market value estimate with a confidence range, an after-repair value estimate reflecting what the property could sell for post-renovation, and a projected hold period. These inputs feed the offer calculation, which outputs a conservative and an aggressive offer figure with the spread between them reflecting deal uncertainty given current condition and market data.
Every scored property in BirdEarly’s feed arrives with a financial starting point already built. The investor still makes the decision. What changes is how much analytical work has already been done before they get there.
What Makes It Reliable
A scoring engine that works in a demo and one that holds up in production are two different things. A few decisions kept this one stable.
Scores only run when data warrants it. Both image scoring and description scoring are change-triggered. This controls cost, keeps the pipeline fast, and prevents stale models from running on inputs that have not moved.
Every score carries a confidence rating. Downstream stages — opportunity scoring, offer calculation, the investor-facing display — treat low-confidence scores differently from high-confidence ones. The investor always knows how much weight to put on what they are reading.
Plain-language observations alongside every score. Numbers alone are not enough for financial decisions. Every scoring dimension produces a description of what the model found. The score ranks the property. The observation explains the rank.
Independent processing stages. A failure in image scoring does not stall description scoring or valuation for any other property moving through the queue. Each stage handles its own failures and retries independently.
Execution timestamps on every model run. Change detection, score history, and coverage monitoring all depend on knowing exactly when each model last ran for each property. These timestamps are stored alongside every output.
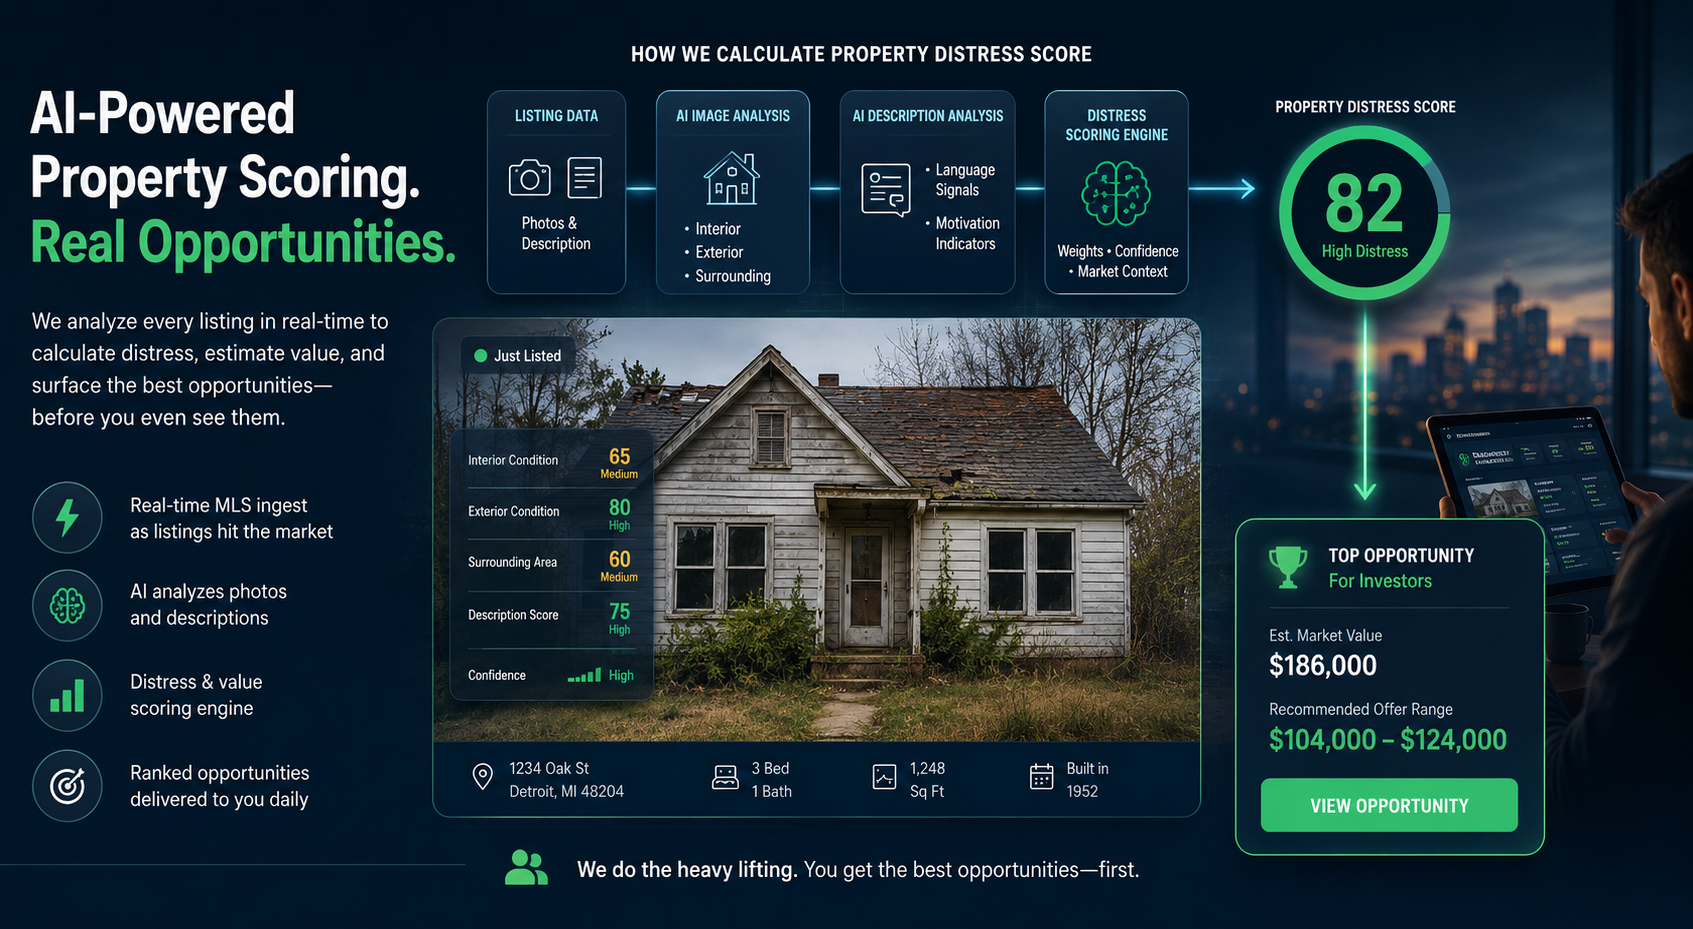
What Investors See
When an investor opens BirdEarly, the work is already done. Every property in their feed has a ranked opportunity score, a distress level, a condition summary across interior, exterior, and surroundings, and a conservative-to-aggressive offer range.
The platform does not show more listings than the raw MLS would. It shows fewer that matter more, with the analysis that would normally take 20 minutes per property already complete.
That is the value proposition. And it only holds up if the scoring underneath it is credible. Investors who open the feed a few times and find the rankings do not reflect reality will stop trusting it. An unreliable ranking is worse than no ranking — it creates false confidence on bad data.
Building reliable scoring requires the quality gating, change detection, confidence calibration, and pipeline architecture described above. None of it is technically exotic. All of it matters.
What to Think Through Before Building This
The architecture here is standard. Event-driven processing, serverless functions, managed queues, cloud storage — these are components any experienced team knows how to work with. The AI calls are API calls to existing models, not custom model training.
What most teams underestimate is the framework work that has to happen before the build. What signals actually predict investment opportunity for your specific users? How should image signals and description signals be weighted relative to each other? What level of image quality is sufficient for a reliable score, and what happens when properties fall below it? How do you define distress for a fix-and-flip investor versus a buy-and-hold investor?
These are product decisions. They require knowing your users’ decision-making process well enough to model it. Getting them wrong means building a technically sound system that produces outputs investors do not trust or cannot act on.
The engineering work is the easier half. The product thinking is where most of the risk lives.
Next in the series: Investor Scoring and Intent Profiling — how behavioral signals from a platform can rank investors by acquisition readiness.
GTC builds AI-powered systems across real estate, auctions, SaaS, and enterprise software. If you are thinking through a scoring engine or data pipeline for your platform, let’s talk.